COMMUNICATIONS
Communication has always been part of human nature. Thanks to technology and science, we can speak with people who are on the other side of the planet. Moreover, it is possible to see things happening anywhere in the world in real time.
- ELECTROMAGNETIC RADIATION
Energy moves throughout space in form of radiation. This is how the light and heat from the sun reach us and how radio and television signals are transmited.
FORM OF RADIATION
It is a wave form. It is a dual sine wave, which meaning it transports two waves:
ONE ELECTRIC
OTHER MAGNETIC⎬ mixed in the same emission

THE PARAMETERS THAT DEFINE A WAVE
FREQUENCY: (f) is the number of occurences of a repeating wave per unit of time. It´s meaured in Hertzs (Hz). (How often they occur per second)
AMPLITUDE: (A) is the difference between the maximum and the mean value of a wave.
PERIOD:(T) is the time it takes for a wave to complete a cycle. If the wave´s period is reduced, it takes less time for the wave to move through the cycle, therefore the frequency increases.
WAVELENGTH:(𝛌) is the shortest distance between points where a wave pattern repeats itself.
It is defined by the following formula:
𝛌= c. T
c (speed of the wave, usually the light speed)
T (is the wave period)

- THE IONOSPHERE
The density and composition of the atmosphere vary according to altitude. Based on these variations, the atmosphere can be divided into layers.
The gases that make up this atmospheric layer have an extremely low density, meaning that the atoms of those elements have lost electrons, what makes the ionosphere a good electrical conductor, favouring the propagation of electromagnetic waves.


-Low frequency waves: they are reflected near the earth (AM)
-Higher frequency waves: they are reflected further
-Highest frequency waves: they pass through the atmosphere (FM, TV waves)
- THE MODULATION AND TRANSMISSION WAVES

AM (AMPLITUDE MODULATION)
Has a longer range but they are poorer cause they are sensitive to noise and they are easier to interfere with. This kind of emission is good in mountainous areas.
Also they work better during the night due to the variations of the layer in that time.
FM (FREQUENCY MODULATION)
Has a higher bandwidth, the noise doesn´t affect it so much so the emission is clear, but they can not get long range os transmission. This kind of emission is better in plane areas.

SO....WHICH ONE IS BETTER?
Depends on the quality,
FM has better quality but not a good a range.
However,
AM has a better range but poorer quality
Modulation is a technique that is necessary for the transmission of electromagnetic signal and through which the original signal is modified by a carrier signal.
Modulating means hiding information in a signal called modulating wave. This is done through a high frequency carrier wave, which results in a high frequency modulating wave that is used to transmit the information. This process require a modulator.


- BANDWIDTH
It is the ranfe of data you can send or receive.
Also It is the result of the difference between both side signals (upper sideband frequency Fₕ and lower sideband frequency Fₗ)
Now we are going to watch a video about "How a satellite works" to get information about the principal use of satellites, what are they made of and so on.
ACTIVITIES
INSTALACIONES EN LA VIVIENDA
PARTE 1INSTALACIONES ELECTRICAS VOCABULARIO
INSTALACIONES DE LA VIVIENDA
Ahora vamos a ver ejemplos de electrificación en las diferentes estancias de una vivienda.
SALÓN:


ACCESO A LA VIVIENDA Y VESTÍBULO


COCINA


BAÑOS


DORMITORIO


PLANOS EJEMPLO INSTALACIONES
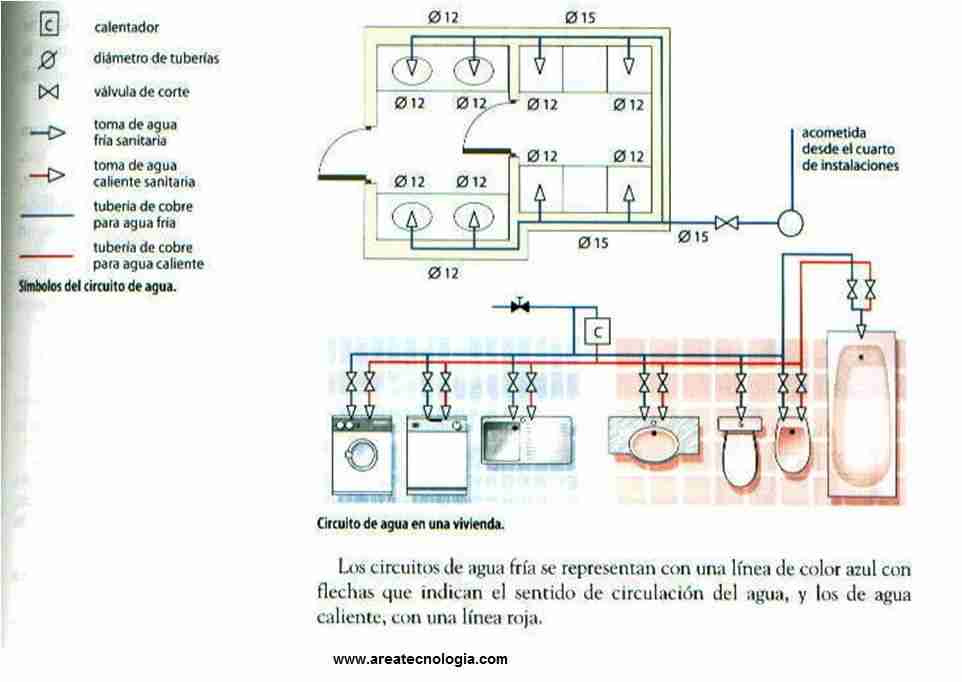
AGUA SANITARIA


ACTIVIDAD 1. TRAZA LA INSTALACIÓN ELÉCTRICA Y DE AGUA SANITARIA DE LA SIGUIENTE VIVIENDA.


GAS BUTANO. PARTES DE LA BOMBONA E INSTALACIÓN

ELECTRICIDAD

CANALIZACIÓN DE ELECTRICIDAD


ACTIVIDAD 1. TRAZA LA INSTALACIÓN ELÉCTRICA Y DE AGUA SANITARIA DE LA SIGUIENTE VIVIENDA.

PARTE 2
Crear una infografía interactiva sobre las instalaciones de la vivienda. ¿CÓMO?

Y a su vez suele ser uno de los trabajos que más suele gustar a los alumnos. Por lo que en esta ocasión vamos a aprender a realizar infografías interactivas con la aplicación de Google Drawing.


2. DOWNLOAD FILE:Start by visiting http://processing.org/download and selecting the Mac,
Windows, or Linux version, depending on what machine you have. Installation on each machine is straightforward:
» On Windows, you’ll have a .zip file. Double-click it, and drag the folder inside to a location on your hard disk. It could be Program Files or simply the desktop, but the important thing is for the processing folder to be pulled out of that .zip file. Then double-click processing.exe to start.


 size (200,200); background (225);
Crear una infografía interactiva sobre las instalaciones de la vivienda. ¿CÓMO?

La infografía es uno de mis recursos favoritos para trabajar en clase, debido a que te permite comunicar tus ideas de forma visual y eficaz.
Y a su vez suele ser uno de los trabajos que más suele gustar a los alumnos. Por lo que en esta ocasión vamos a aprender a realizar infografías interactivas con la aplicación de Google Drawing.
Tarea
- Inicia sesión en Google Drive, y dentro de una carpeta de Tecnología, crea un archivo nuevo de Google Drawing.
- A continuación debes ver el siguiente vídeo, en el que se explica cómo usar esta aplicación de una forma sencilla.
- Añade un colaborador dentro del archivo de Google Drawing, ya que este trabajo se realizará en grupos de cuatro personas.
- Crea una infografía sobre los tipos de instalaciones de las viviendas. Para ello puedes utilizar fotografías propias o presentes en la web que dispongan de licencia Creative Commons.
- Y no olvides darle interactividad a tu trabajo, añadiendo enlaces relevantes en palabras clave del mismo.
Tras finalizar la infografía, deberás compartirla con tu profesora, para que pueda darte feedback.
Puedes consultar en la siguiente imagen la diana de evaluación para valorar la infografía, con ella realizaremos una autoevaluación del trabajo realizado.

Puedes consultar en la siguiente imagen la diana de evaluación para valorar la infografía, con ella realizaremos una autoevaluación del trabajo realizado.

PROCESSING
- WHAT IS IS? First of all you may need to look for the definition on The Internet, do not forget to write it all on a paper sheet to give it to your teacher when she comes back.

» On Windows, you’ll have a .zip file. Double-click it, and drag the folder inside to a location on your hard disk. It could be Program Files or simply the desktop, but the important thing is for the processing folder to be pulled out of that .zip file. Then double-click processing.exe to start.
Look at the following video, for whose did not understand the text on the top.
IF YOU HAVE SEEN THE VIDEO, I AM REALLY DISAPPOINTED WITH YOU GUYS, 
SO YOU ARE NOT GOING TO HAVE A PRESENT FOR IRELAND.
With any luck, the main Processing window will now be visible (Figure 2-1).

You’re now running the Processing Development Environment (or PDE).
There’s not much to it; the large area is the Text Editor, and there’s a row
of buttons across the top; this is the toolbar. Below the editor is the Message Area, and below that is the Console. The Message Area is used for
one-line messages, and the Console is used for more technical details.
Everyone’s setup is different, so if the program didn’t start, or you’re
otherwise stuck, visit the troubleshooting page for possible solutions:
http://wiki.processing.org/index.php/Troubleshooting.
3. GETTING STARTED: We are going to start with something easy. What is easier than a point or a line? This will be a piece of cake!!
In the editor, type the following:
point (0,0);
line (25,25,50,50);
point (75,75);
Click the Run button, which looks like this:

If you’ve typed everything correctly, you’ll see the line between two points image above.
If
you didn’t type it correctly, the Message Area will turn red and complain
about an error. If this happens, make sure that you’ve copied the example code exactly: the numbers should be contained within parentheses
and have commas between each of them, and the line should end with a
semicolon.
One of the most difficult things about getting started with programming
is that you have to be very specific about the syntax. The Processing
software isn’t always smart enough to know what you mean, and can be
quite fussy about the placement of punctuation. You’ll get used to it with a
little practice.

If you type the following code, you will get:
 size (200,200); background (225);
stroke (0);
strokeWeight (10);
point (0,0);
stroke (255,0,0);
line (25,25,50,50);
stroke (127);
strokeWeight (5);
point (75,75);
line (100,100,125,125);
strokeWeight (1);
stroke (0);
fill (0,255,0);
rect (150,150,50,50);
4. COLOURS IN PROCESSING:
All the shapes so far have been filled white with black outlines, and the background of the Display Window has been light gray. To change them, use the background(), fill(), and stroke() functions. The values of the parameters are in the range of 0 to 255, where 255 is white, 128 is medium gray, and 0 is black.

All the shapes so far have been filled white with black outlines, and the background of the Display Window has been light gray. To change them, use the background(), fill(), and stroke() functions. The values of the parameters are in the range of 0 to 255, where 255 is white, 128 is medium gray, and 0 is black.
Draw with Color
To move beyond grayscale values, you use three parameters to specify
the red, green, and blue components of a color.
This is referred to as RGB color, which comes from how computers define colors on the screen. The three numbers stand for the values of red, green, and blue, and they range from 0 to 255 the way that the gray values do. Using RGB color isn’t very intuitive, so to choose colors, use Tools➝Color Selector, which shows a color palette similar to those found in other software. Select a color, and then use the R, G, and B values as the parameters for your background(), fill(), or stroke() function.
Set Transparency: By adding an optional fourth parameter to fill() or stroke(), you can control the transparency. This fourth parameter is known as the alpha value, and also uses the range 0 to 255 to set the amount of transparency. The value 0 defines the color as entirely transparent (it won’t display), the value 255 is entirely opaque, and the values between these extremes cause the colors to mix on screen.This parameter is written right after the colour one.

Do not forget to make screenshoots about your practices, those will be marked when I finish my trip.
ENJOY THE WEEK!! DO NOT MISS ME A LOT DESPITE WHAT YOU´LL THINK,
I WILL.
I WILL.

EXERCISES
Example 2.1
In the editor, type the following:
ellipse(50, 50, 80, 80);
This line of code means “draw an ellipse, with the center 50 pixels over
from the left and 50 pixels down from the top, with a width and height of
80 pixels.”
Example 2.2
Sometimes you will need to write what you are drawing just in case somebody needs to know, that is why I will teach you how to do it.
In processing there are two types of comments:
-The comments at the end of line start with //
-The longer comments start with /* and end with */
Now we are going to draw a tri-colour flag.
In the editor, type the following:

Apart from that,you can also write comments in your drawings.

Example 2.2
void setup() {
size(480, 120);
smooth();
}
void draw() {
if (mousePressed) {
fill(0);
} else {
fill(255);
}
ellipse(mouseX, mouseY, 80, 80);
}
This program creates a window that is 480 pixels wide and 120 pixels
high, and then starts drawing white circles at the position of the mouse.
When a mouse button is pressed, the circle color changes to black. We’ll
explain more about the elements of this program in detail later. For now,
run the code, move the mouse, and click to experience it.

Example 2.3
Draw Part of an Ellipse

The arc() function draws a piece of an ellipse:
size(480, 120);
arc(90, 60, 80, 80, 0, HALF_PI);
arc(190, 60, 80, 80, 0, PI+HALF_PI);
arc(290, 60, 80, 80, PI, TWO_PI+HALF_PI);
arc(390, 60, 80, 80, QUARTER_PI, PI+QUARTER_PI);
The first and second parameters set the location, the third and fourth
set the width and height. The fifth parameter sets the angle to start the
arc, and the sixth sets the angle to stop. The angles are set in radians,
rather than degrees. Radians are angle measurements based on the value
of pi (3.14159). Figure 3-2 shows how the two relate. As featured in this
example, four radian values are used so frequently that special names for
them were added as a part of Processing. The values PI, QUARTER_PI,
HALF_PI, and TWO_PI can be used to replace the radian values for 180º,
45º, 90º, and 360º.
Example 2.4
Control Your Drawing Order
size(480, 120);
ellipse(140, 0, 190, 190);
// The rectangle draws on top of the ellipse
// because it comes after in the code
rect(160, 30, 260, 20);
Modify Example 2.4 by reversing the order of rect() and ellipse() to see
the circle on top of the rectangle:
size(480, 120);
rect(160, 30, 260, 20);
// The ellipse draws on top of the rectangle
// because it comes after in the code
ellipse(140, 0, 190, 190);
Example 2.5
Draw Basic Shapes
Following this pattern, a triangle needs six parameters and a quadrilateral
needs eight (one pair for each point):
size(480, 120);
quad(158, 55, 199, 14, 392, 66, 351, 107);
triangle(347, 54, 392, 9, 392, 66);
triangle(158, 55, 290, 91, 290, 112);

Example 2.6
Set Stroke Weight
The default stroke weight is a single pixel, but this can be changed with
the strokeWeight() function. The single parameter to strokeWeight() sets
the width of drawn lines:
size(480, 120);
smooth();
ellipse(75, 60, 90, 90);
strokeWeight(8); // Stroke weight to 8 pixels
ellipse(175, 60, 90, 90);
ellipse(279, 60, 90, 90);
strokeWeight(20); // Stroke weight to 20 pixels
ellipse(389, 60, 90, 90);

Example 2.7
DRAW AN ARROW
The beginShape() function signals the start of a new shape. The vertex()
function is used to define each pair of x- and y-coordinates for the shape.
Finally, endShape() is called to signal that the shape is finished.
size(480, 120);
beginShape();
vertex(180, 82);
vertex(207, 36);
vertex(214, 63);
vertex(407, 11);
vertex(412, 30);
vertex(219, 82);
vertex(226, 109);
endShape();

When you run Example 2.7, you’ll see the first and last point are not
connected. To do this, add the word CLOSE as a parameter to endShape(),
like this:
size(480, 120);
beginShape();
vertex(180, 82);
vertex(207, 36);
vertex(214, 63);
vertex(407, 11);
vertex(412, 30);
vertex(219, 82);
vertex(226, 109);
endShape(CLOSE);
EXAMPLE 2.8
CREATE SOME CREATURES
The power of defining shapes with vertex() is the ability to make shapes
with complex outlines. Processing can draw thousands and thousands of
lines at a time to fill the screen with fantastic shapes that spring from your
imagination. A modest but more complex example follows:
size(480, 120);
smooth();
// Left creature
beginShape();
vertex(50, 120);
vertex(100, 90);
vertex(110, 60);
vertex(80, 20);
vertex(210, 60);
vertex(160, 80);
vertex(200, 90);
vertex(140, 100);
vertex(130, 120);
endShape();
fill(0);
ellipse(155, 60, 8, 8);
// Right creature
fill(255);
beginShape();
vertex(370, 120);
vertex(360, 90);
vertex(290, 80);
vertex(340, 70);
vertex(280, 50);
vertex(420, 10);
vertex(390, 50);
vertex(410, 90);
vertex(460, 120);
endShape();
fill(0);
ellipse(345, 50, 10, 10);

EXAMPLE 2.9
REUSE THE SAME VALUES
For instance, when you make the y-coordinate and diameter for the two
circles in this example into variables, the same values are used for each
ellipse:
size(480, 120);
smooth();
int y = 60;
int d = 80;
ellipse(75, y, d, d); // Left
ellipse(175, y, d, d); // Middle
ellipse(275, y, d, d); // Right

Change Values
Simply changing the y and d variables therefore alters all three ellipses:
size(480, 120);
smooth();
int y = 100;
int d = 130;
ellipse(75, y, d, d); // Left
ellipse(175, y, d, d); // Middle
ellipse(275, y, d, d); // Right

When you make your own variables, you determine the name, the data
type, and the value. The name is what you decide to call the variable.
Choose a name that is informative about what the variable stores, but be
consistent and not too verbose.
For instance, the variable name “radius”
will be clearer than “r” when you look at the code later.
The range of values that can be stored within a variable is defined by its
data type. For instance, the integer data type can store numbers without
decimal places (whole numbers). In code, integer is abbreviated to int.
There are data types to store each kind of data: integers, floating-point
(decimal) numbers, characters, words, images, fonts, and so on.
Variables must first be declared, which sets aside space in the computer’s
memory to store the information. When declaring a variable, you also
need to specify its data type (such as int), which indicates what kind of
information is being stored. After the data type and name are set, a value
can be assigned to the variable:
int x; // Declare x as an int variable
x = 12; // Assign a value to x
This code does the same thing, but is shorter:
int x = 12; // Declare x as an int variable and assign a value
The name of the data type is included on the line of code that declares a
variable, but it’s not written again. Each time the data type is written in
front of the variable name, the computer thinks you’re trying to declare
a new variable. You can’t have two variables with the same name in the
same part of the program (see Appendix D), so the program has an error:
int x; // Declare x as an int variable
int x = 12; // ERROR! Can’t have two variables called x here
EXAMPLE 3.1
A LITTLE MATH
People often assume that math and programming are the same thing. Although knowledge of math can be useful for certain types of coding, basic
arithmetic covers the most important parts.
Basic Arithmetic
size(480, 120);
int x = 25;
int h = 20;
int y = 25;
rect(x, y, 300, h); // Top
x = x + 100;
rect(x, y + h, 300, h); // Middle
x = x - 250;
rect(x, y + h*2, 300, h); // Bottom

In code, symbols like +, –, and * are called operators.
When placed between
two values, they create an expression.
For instance, 5 + 9 and 1024 – 512
are both expressions. The operators for the basic math operations are:
+ Addition
– Subtraction
* Multiplication
/ Division
= Assignment
Processing has a set of rules to define which operators take precedence
over others, meaning which calculations are made first, second, third,
and so on. These rules define the order in which the code is run. A little
knowledge about this goes a long way toward understanding how a short
line of code like this works:
int x = 4 + 4 * 5; // Assign 24 to x
EXAMPLE 3.2
DO THE SAME THING OVER AND OVER
This example has the type of pattern that can be simplified with a for loop:
size(480, 120);
smooth();
strokeWeight(8);
line(20, 40, 80, 80);
line(80, 40, 140, 80);
line(140, 40, 200, 80);
line(200, 40, 260, 80);
line(260, 40, 320, 80);
line(320, 40, 380, 80);
line(380, 40, 440, 80);

Example 3.3:
Use a for Loop
The same thing can be done with a for loop, and with less code:
size(480, 120);
smooth();
strokeWeight(8);
for (int i = 20; i < 400; i += 60) {
line(i, 40, i + 60, 80);
}
The for loop is different in many ways from the code we’ve written so far.
Notice the braces, the { and } characters. The code between the braces
is called a block. This is the code that will be repeated on each iteration of
the for loop.
Inside the parentheses are three statements, separated by semicolons,
that work together to control how many times the code inside the block is
run. From left to right, these statements are referred to as the initialization
(init), the test, and the update:
for (init; test; update) {
statements
}
The test statement requires more explanation. It’s always a relational
expression that compares two values with a relational operator.
In this
example, the expression is “i < 400” and the operator is the < (less than)
symbol.
The most common relational operators are:
> Greater than
< Less than
>= Greater than or equal to
<= Less than or equal to
== Equal to
!= Not equal to
EXAMPLE 3.4
FLEX YOUR FOR LOOP´S MUSCLES
The ultimate power of working with a for loop is the ability to make quick
changes to the code. Because the code inside the block is typically run
multiple times, a change to the block is magnified when the code is run.
By modifying Example 4-6 only slightly, we can create a range of different
patterns:
size(480, 120);
smooth(); ´
strokeWeight(2);
for (int i = 20; i < 400; i += 8) {
line(i, 40, i + 60, 80);
}

PUERTAS LÓGICAS- ÁLGEBRA DE BOOLE
No hay comentarios:
Publicar un comentario